How to Read YouTube's Trending Chart Like an Analyst (Worked on Today's Chart)
By TubeScope Editorial Team · 2026-09-08 · 8 min read
The Trending tab looks like a list. It is actually a dataset, and read properly it tells you what is working on YouTube right now — which formats, which hooks, and which small channels just broke through. Below is that reading done on the real US chart for September 8, 2026, using the Trending tool's numbers. The chart will have changed by the time you read this; the method will not.
Step 1: pick the right chart
The all-categories chart and a category chart are different animals. On the day this was written, only 2 of the 50 videos with a duration on the main US chart were Shorts — it was gaming streams, a K-pop video, and a game trailer. The Science & Technology chart was the opposite: 34 of 50 were Shorts under sixty seconds. If you make long-form tech videos and only look at the category chart, you will conclude the format is dead. It is not; the category chart is simply where tech Shorts live. Read both, and separate them.
Step 2: rank by velocity, not views
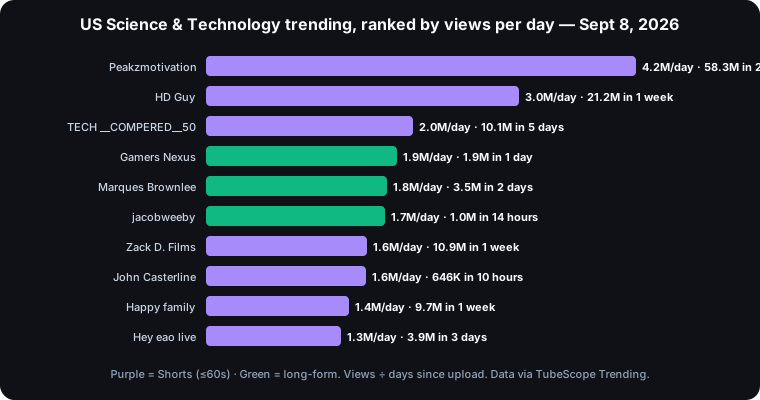
Divide views by days since upload. The top of the Science & Technology chart by velocity was a Short from Peakzmotivation — 58.3M views in 2 weeks ago, about 4.2M a day. But look at the long-form entries in green. Gamers Nexus put a 2 hour 15 minute investigation on the chart with 1.9M views in a single day, and Marques Brownlee's Pixel review reached 3.5M in two days. A two-hour video trending beside fifteen-second clips is the clearest possible evidence that length is not the variable — pull is.
Step 3: check the channel size
This is the step almost nobody does, and it is where the money is. Look up each trending channel's subscriber count:
- The Radio Zoomer — 16.7K subscribers, 5.7M views on a video about Morse code speeds. That is a channel with a tiny audience whose video found an enormous one. Something in that title and thumbnail worked without any subscriber push, and it is worth ten minutes of your attention.
- Curiosity Clips — 18.7K subscribers, 8.7M views. Same story: a breakout, not a big-channel default.
- AlanTech — 126K subscribers, 6.2M views. Mid-sized channel, outsized result.
- CarterPCs — 3.42M subscribers, 1.2M views. For a channel that size, an ordinary day. Nothing to learn here except that big channels trend by default.
A breakout from a small channel is the purest signal on the chart: the format carried the video, not the audience. Study those first.
Step 4: read the titles as a set
Across the tech Shorts the hooks repeat: a leak ("They fully leaked iPhone 18 colors"), an exposure ("MY OLDEST iPAD EXPOSED EVERYTHING"), a battle ("Samsung vs Nokia vs iPhone Battery Battle"), a price shock ("Cost in Units of RTX 5090"). Across the long-form entries the hooks are different: an investigation with a number in the title ("216,000,000 Spy TVs"), a review with a personality ("Poker Face"). Two formats, two vocabularies. Borrow from the one you actually make.
Step 5: decide what to do this week
- If a hook pattern appears three times, it is a format, not a fluke. Adapt it to your topic — run your version through the Title Rewriter rather than copying the phrasing.
- Put your thumbnail next to the trending ones in the Thumbnail Tester; the feed you will sit in is right there.
- Note the small-channel breakouts and open their channels: what did they do differently from their own previous ten videos?
- Trends decay in days. Act on the pattern, not the video.
The main chart that day, for the record: a gaming stream at 4.7M views in seven hours, two more streamers, a K-pop debut, and a Street Fighter trailer. Different surface, different rules — which is exactly why the category filter exists.
Frequently asked questions
How does YouTube decide what is trending?
YouTube's chart weights view velocity, where the views come from, and the video's age, and it filters out clickbait-heavy or repetitive content. It is regional, and category charts are separate from the main chart. Being on it is not required for growth.
Why is the trending chart full of Shorts?
Category charts often are: on September 8, 2026 the US Science and Technology chart was 34 of 50 Shorts, while the main US chart was almost entirely long-form. Read both, and separate the Shorts patterns from the long-form ones before drawing conclusions about your format.
What is the most useful number on the trending chart?
Views per day — lifetime views divided by days since upload. It separates videos that are genuinely hot from videos that are merely old. The second most useful is the channel's subscriber count, which tells you whether a video trended on its format or on its audience.
Why should I care about small channels on trending?
A video from a channel with a few thousand subscribers that reaches millions of views got there on its title, thumbnail, and topic alone — no subscriber push. That is the purest evidence available of a format that works, and it is worth studying before anything from a big channel.
How often should I check trending?
Once a week for your category is enough. Note any hook or format that appears two or three times; that repetition is the signal. Trends decay within days, so act on the pattern rather than chasing a single video.
Try it yourself: Trending Videos · Title Rewriter · Thumbnail Tester